The authors developed a proportional incidence model to estimate vaccine effectiveness (VE) but at the population level. Understanding VE during the COVID-19 pandemic was very important. Since obtaining individual level data linkages, the authors used aggregated counts from publicly available registries of COVID-19 hospital and intensive care unit admissions. They assumed the occurrence of events arise from a Poisson process and then formulated a proportional incidence rate model for aggregated marginal counts.
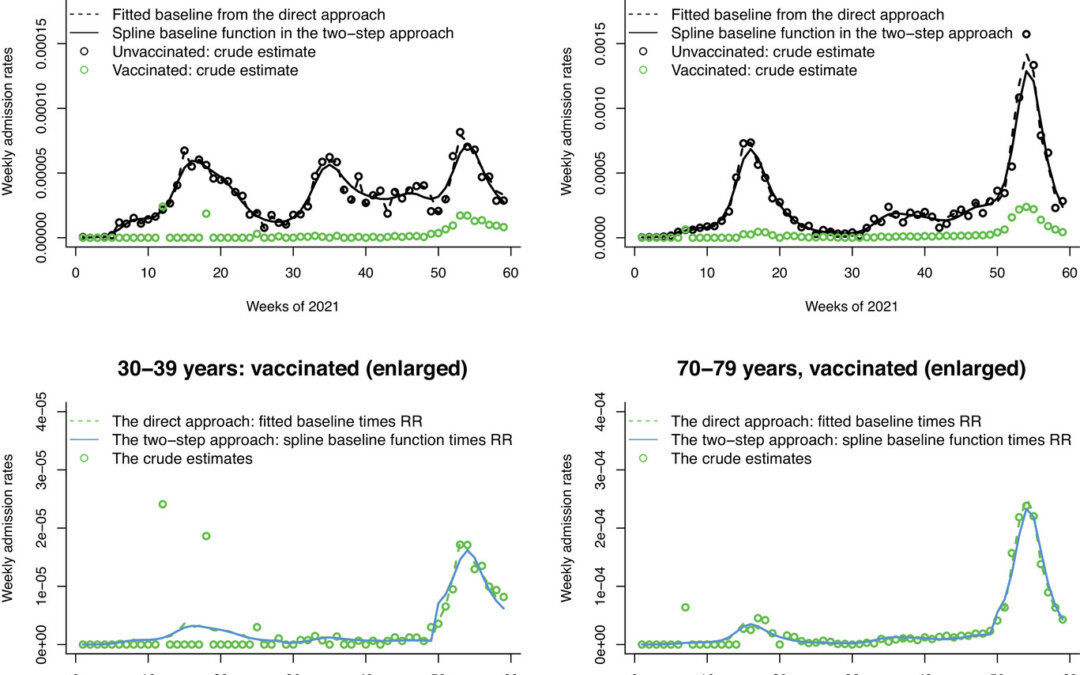
In their methods, they define an instantaneous rate ratio (RR), r(t) as the ratio of two incidences, the vaccinated by the unvaccinated. Then they calculated VE(t) = 1 – r(t). They then expanded about r(t) by making it into a weekly aggregated RR. They derived a joint likelihood approach to estimate RR and baseline incidence. Since they said researchers prefer smooth baseline incidence rate estimates, they used a two-step approach to model the baseline incidence as a smooth function by thin plate regression splines (Wood, 2003) and a penalized spline method, where data from the unvaccinated as used to estimate the baseline incidence rate. Then in the second step, they insert the estimated baseline incidence from the first step in to the full log-likelihood function, which is based on data only from the vaccinated group. In their two-step approach, they stated that a well calibrate penalized splines would yield valid estimates of the beta coefficients and would be close to the values obtained through their direct approach.
For assessing VE amongst various groups which have covariates that could be time-dependent, like age, they estimated RR from a log-linear model. They in addition show extending their method to multiple vaccinations. They applied their methods to analyze weekly incidence counts of hospital and ICU admissions in Ontario, Canada between January 4, 2021 and February 20, 2022. They employed both direct and two-step approaches on this data. They found that while point estimates were nearly identical that the direct approach appeared to capture more randomness in the data from the unvaccinated group in its conditional likelihood while the two-step approach, which did not involve data from the unvaccinated group in its likelihood but rather through the incidence for the unvaccinated via the bootstrapping.
Through their model, they were able to understand time-dependent vaccine effects, like potentially waning immunity after 2 doses especially in the Omicron era. They found the 3rd dose offered good protection against being admitted to the hospital or worse, in the ICU. Most of their limitations were around that they did not have longitudinal cohort so as they have admitted, it becomes hard to suggest waning immunity. Also, if they had person level data, then they could have controlled for confounding and distinguished ICU or hospital admissions and also had information on prior exposure to infections. Of note was the inability to control for mask wearing among unvaccinated and vaccinated groups as well.
Written by,
Usha Govindarajulu
Keywords: COVID-19, incidence rate, aggregated data, vaccine effectiveness
References
Wood, S.N. (2003) Thin plate regression splines. Journal of the Royal Statistical Society, Series B, 65, 95–114.
Yan P, Mullah MAS, and Tuite A (2023). “A proportional incidence rate model for aggregated data to study the vaccine effectiveness against COVID-19 hospital and ICU admissions.” Biometrics.
https://onlinelibrary.wiley.com/doi/full/10.1111/biom.13915?campaign=wolearlyview