August 3, 2022
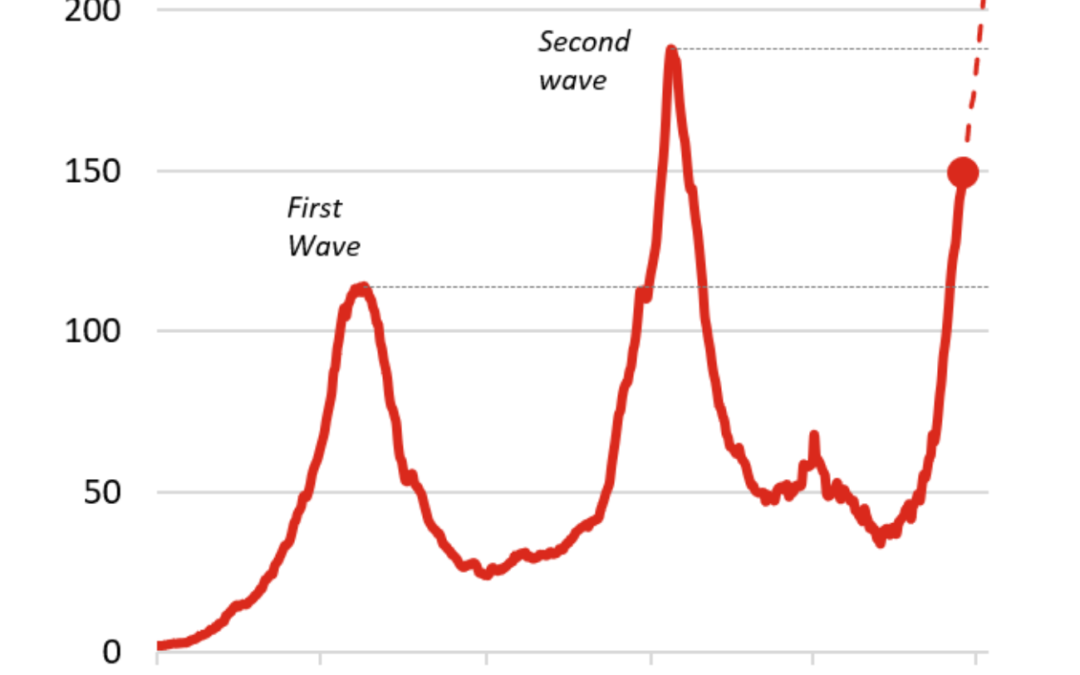
In a recent article in BMJ Global Health, James et al discuss a statistical analysis they performed on retrospective data on SARS-CoV-2 infections during the first wave of the COVID-19 pandemic in sub-Saharan African countries using World Health Organization (WHO) data resources. As they report, it was a cross-sectional analysis on data reported from 47 member states of the WHO African region during the first wave. They then pulled predictor variables from publically available datasets like WHO again and World Bank, etc..
The article has an extensive section on statistical analysis but we’ve make some points. In their section about missing data and imputation, the authors said they had 11 missing values in their dataset from certain countries. They then decided to use a mean value imputation and they specify the equation to calculate initial stringency which is the median of the square root of the initial stringency quantity squared. Mean value imputation is a biased way to impute data which can bias the estimates. They then go on to discuss collinearity, transformations of outcomes, and principal component analysis. They then used these principal components (PC) in a generalized linear model with a negative binomial error distribution, which from what we can garner, for their count type outcomes, and also perhaps using the negative binomial due to anticipated greater variability amongst the outcomes. Next they used a stepwise AIC function in the R programming language to select the best set of predictors. Though in general stepwise can be biased, especially when used with p-values for variable selection, it is a somewhat of an improvement to use it with AIC as the measure of best fit. They also adjusted for multiplicity using the Benjamini-Hochberg method. Finally, they did remove countries that reported fewer than 10 deaths due to fitting the negative binomial GLM models.
They did find that the cumulative attack rate and monthly attack rate were highly positively related to PC3 (higher urbanization, lower overall population density and higher mean stringency; p<0.001) and PC1 (high tourism, high per capita GDP, high fishing volume, older population; p><0.001), and to a lesser extent, negatively related to PC4 (lower preparedness and higher initial stringency; p><0.02; figure 4). CFR was negatively influenced by PC1 (p=0.021), meaning that CFRs were lower in wealthier Member States with large tourism and fishing industries, despite those also being the countries with older populations. This relationship was also evident in the pairwise correlation matrix between response indicators, where attack rates were weakly negatively correlated to CFR (online supplemental figure S3). The delay in the detection of the first COVID-19 case relative to its first detection in the region, the epidemic start delay, was longer in countries with higher values of PC4 (more stringent COVID-19 control measures and lower preparedness, p><0.002) and lower values of PC2 (p=0.008), referring to lower latitude, higher attack rate among neighbouring countries, and lower proportion of males in the population. The initial epidemic growth period was more protracted in countries with higher values of PC1 (high tourism, high per capita GDP, high fishing volume per capita, older population; p=0.023), which corresponded to many of the small island Member States (online supplemental figure S6). The Benjamini-Hochberg adjustment for multiple tests did not result in any qualitative change in these results (highest unadjusted significant p value=0.023 became 0.026 following adjustment)><0.001) and PC1 (high tourism, higher per capita GDP, high fishing volume, older population; p<0.001). Case fatality ratios were higher lower in wealthier Member States that had large tourism and fishing industries. Also, they found that delay in detecting the first COVID-19 case relative to its first detection in the region was longer in countries with higher values of PC4 (more stringent COVID-19 control measures and lower preparedness, p<0.002). Finally, the initial epidemic growth period ended up being more protracted in duration with higher values of PC1 (high tourism, high per capita GDP, high fishing volume per capita, older population; p<0.023). They claimed the Benjamini-Hochberg adjustment did not result in any qualitative changes in these results.
They summarized that their study is one of the most comprehensive studies that describes the first wave of the COVID-19 pandemic in Africa and they stood by their conclusions, however they did admit that there was wide heterogeneity in response capacity across the African countries, lack of standardization in testing and issues with the case fatality rates, which did not take into account inherent lag in reporting of deaths and their occurrence. Also, there analyses were at a population level and not individual data, for which they did not have all access but which could have been helpful. However, they felt this analyses was useful to bring attention to this matter and also mobilize countries to better organize their response to future threats.
Written by,
Usha Govindarajulu
Keywords: COVID-19, statistics, Africa, WHO, first wave, imputation, principal components analysis, negative binomial, generalized linear model
References
James A, Dalal J, Kousi T, et al. An in-depth statistical analysis of the COVID-19 pandemic’s initial spread in the WHO African region. BMJ Global Health 2022;7:e007295.https://gh.bmj.com/content/bmjgh/7/4/e007295.full.pdf
https://blogs.imf.org/wp-content/uploads/2021/06/eng-afr-june-24-chart-1-3.png
