September 13, 2023
In their paper, the authors, Wang et al focused on estimation of casual effects of a treatment on survival outcomes with censoring with propensity score (PS) adjustment. They also used alternative measures of survival like restricted average causal effect (RACE) and survival probability causal effect (SPCE). For RACE they defined this as the difference in the area under survival curves up to some time point, tau, between the treatment and control groups while the SPCE was defined as the difference of the survival probabilities at a given time point, t, between the treatment and control groups. They then said that as t goes to infinity that the SPCE degenerates to a difference in cure rates of different groups. In their propsal, they combined PS stratification in a model with covariate adjustment with a cure fraction, where only the PS model needed to be correctly specified.
In the description of their methods, they denoted the censoring time as what they called “random censoring” without indiciating that it is actually “random right censoring”. They also defined the pair (T(1), T(0)) of potential (counterfactual) outcomes (Robins, 1986; Rubin, 1974) through the average causal effect (ACE) as the difference in this pair while RACE is more widely used is the difference of this pair, where each is the causal effect of treatment for either treatment or control group. This can be further modified by adding in the cure fraction. Regarding addition of the propensity score, they argue that in RCTs, the treatment assignment is indepenent of baseline covariates while in observational studies, it almost always depends on the covariates so then covariate adjustment is necessary for causal effect estimation so therefore, they employed PS adjustment as this approach. Going back to RACE, instead of using the Kaplan-Meier estimator for survival, they used an adjusted survival function per a regression model to adjust for covariates in each stratum, making use of the G-computation formula (Robins, 1986). The authors showed implemeting a Beran estimator (Beran, 1981), S-hat(t,z) for the estimated conditional survival which becomes the cure rate. Their final form of the conditional survival was shown to be plugged into either RACE or SPCE.
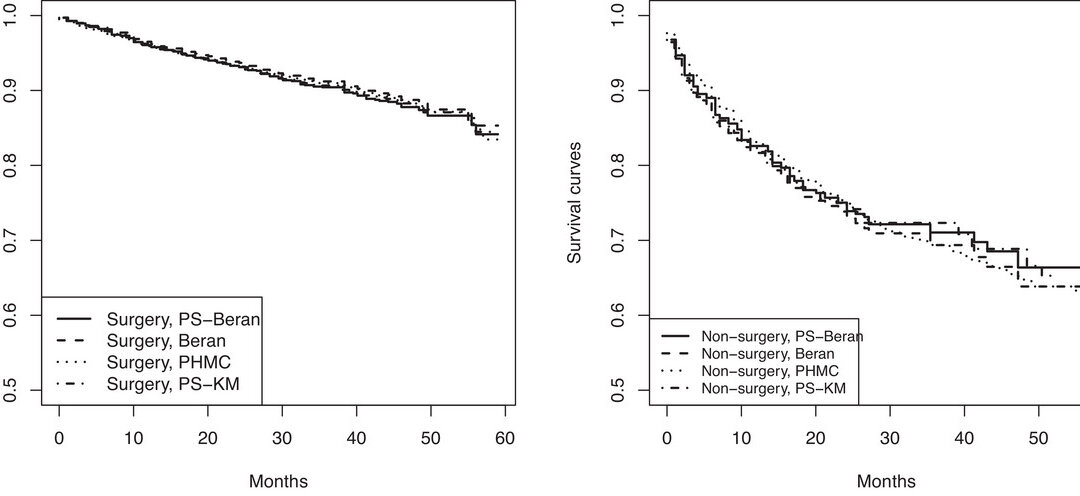
In their simulations, they compared their method, PS-Beran method, to the PS-KM (Kaplan-Meier) method for stratification and also just to the Beran method without stratification and also to the PHMC (PH mixture cure model) and another variation of the Beran model. They then ran these methods for both RACE and SPCE. They found in looking at bias, mean-squared error, and some other measures that their method performed the best as compared to all the other competitors. Again, their method performed well on a real dataset example. In their discussion, one thing they had not figured out was an explicit form of the variance for their proposed estimator rather than having to rely on bootstrapping. However, one major item that had barely been discussed in their results were the causal effects estimates and what that meant. They interpreted the restricted mean time estimates but said nothing about what it mean for these to also be causal effects.
Written by,
Usha Govindarajulu
Keywords: survival, restricted mean survival time, causal effects, propensity weighting, cure fraction
References
Beran, R. (1981). Nonparametric regression with randomly censored survival data. Tech. Rep., University of California, Berkeley.
Robins, J. (1986). A new approach to causal inference in mortality studies with a sustained exposure period-application to control of the healthy worker survivor effect. Mathematical Modelling, 7(9), 1393–1512.
Rubin, D. B. (1974). Estimating causal effects of treatments in randomized and nonrandomized studies. Journal of Educational Psychology, 66(5), 688–701.
Wang Z, Wang C, and Wang X. (2023). “Estimating causal effects in observational studies for survival data with a cure fraction using propensity score adjustment” Biometrical Journal. https://doi.org/10.1002/bimj.202100357
https://onlinelibrary.wiley.com/cms/asset/b9da5730-81bd-4a1c-8314-15419874f8d2/bimj2518-fig-0003-m.jpg