January 16, 2023
In an article recently published online in The Biometrical Journal, Handorf et al seek to understand what is the best way to model survival data in the presence of non-proportional hazards, perhaps from the effect of confounding variables. The authors were particularly interested to compare this for real world data. The authors therefore went through a process of identifying several existing methods that exist in the current literature to handle such problems.
They first discussed propensity score methods, which had been originally introduced by Rosenblum and Rubin in 1983. The original paper laid out the methodology in a lot of detail. Overtime, the use of their methods has either been criticized or continued to be utilized. The authors decided to restrict their interest to weighting or rather IPTW, inverse propensity score weighting. Next they discussed methods that exist under non-proportionality. One of the major methods they discussed was restricted mean survival time (RMST) since this can handle estimating survival under non-proportional hazards. After this they go to discussion of the Cox proportional hazard model where they discussed allowing the hazard to vary by natural logarithm of time and they used a piecewise constant treatment effect. They also presented parametric accelerated failure time models (AFT) and accommodated non-proportionality to allow the hazard ratio to change over time where they focused on a Weibull hazard model with Gumbel error distribution. Another distribution would be the three-parameter gamma model in AFT specification which has a generalized gamma distribution and which allows for most parametric distributions. However, the authors quickly divulge from this into flexible parametric regression models, like the spline-based ones proposed by Royston-Parmer which use proportional hazards or proportional odds models even with IPTW. Also mentioned are the semi-parametric AFT models but they did not meet their inclusion criteria. The Kaplan-Meier was very briefly discussed as a method to estimate survival even with weights. Then the authors discussed pseudo-observations as employed by Andersen et al, 2004 and others in some sufficient detail but not enough to truly motivate the approach. Finally, in terms of variance estimation, the authors motivated the nonparametric bootstrap to estimate variances as well as their corresponding confidence intervals.
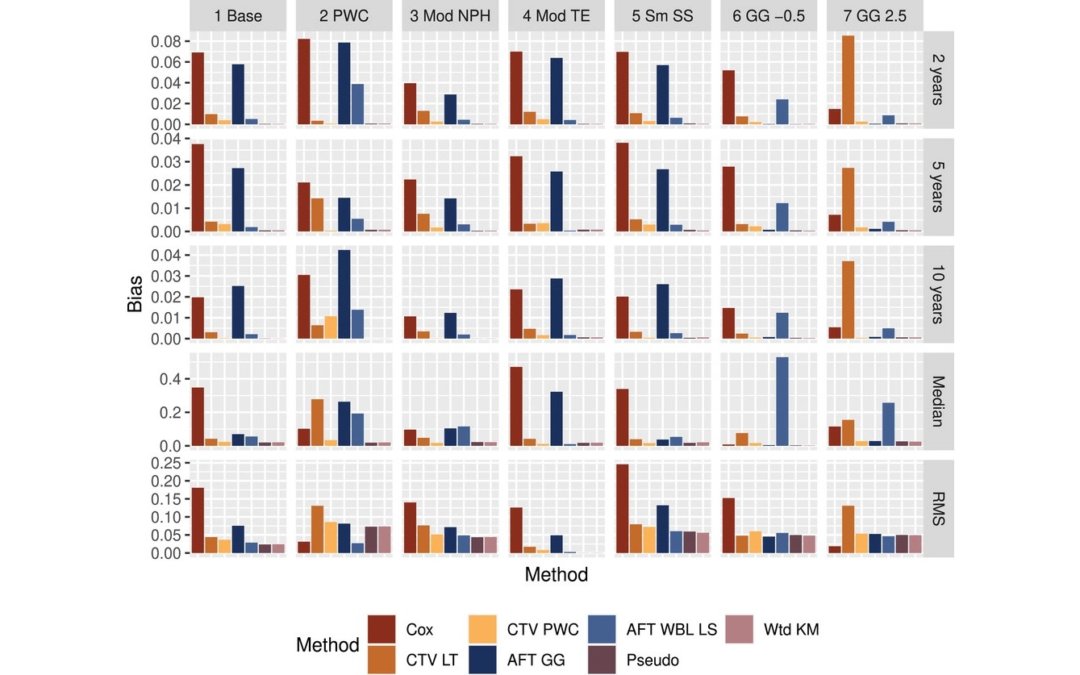
Simulations were then presented to test out all the methods listed above on simulated datasets based on real world criteria for the covariates. They used several R software packages: genOrd to draw variables for the renal dataset, simsurv for generating survival times, and flexsurv for flexible survival regression. They then planned to use various estimates to describe the simulation performance like bias and coverage. In terms of the results, they found the Cox model had the most bias and also the generalized gamma AFT introduced substantial bias. Meanwhile the Kaplan-Meier and the pseudo-observation methods had lowest biases and they also noted the RMS had some smaller biases as it was not affected by choice of method. The coverage was the worst for the Cox model, then again followed by the generalized gamma AFT model. The nonparametric methods had a coverage closest to the nominal level for all the outcomes, but they did have larger SEs of the differences in treatment effects than the parametric/semi-parametric methods. In the case of piecewise hazards, the biases were lower for the non-parametric methods and also for a PWC time-varying Cox model. In general, models with large biases ended up having the worst coverage. Besides the simulations, they also assessed this on two real cancer datasets using the National Cancer Database. In one of the analyses, they found the pseudo-observations method was sensitive to the mean of the estimated weights, more so than the other methods, and they highlighted this deserved further investigation.
The authors did note one of their limitations was using the simple IPTW instead of using alternative weights for the propensity score. Another is that they did not consider unmeasured confounding also because propensity scores will not balance unmeasured confounders. They ended up concluding from their simulations and real data results that the IPTW Kaplan-Meier curves were the best to use to protect against incorrect inferences of treatment effects. However, the authors did not seem to parse out the methods based on unadjusted for covariates, like the Kaplan-Meier method and adjusted for covariates, like the Cox model. It would have been nice if the authors had provided this breakdown in more detail per their simulations and real data results to give better guidance to authors. Also their analyses of the RMST was rather sparse and they could have provided some more guidance on this. In general, it was a fairly thorough review of existing statistical methodology for survival analysis in the guise of non-proportional hazards, which is always changing.
Written by,
Usha Govindarajulu
Keywords: survival, propensity score, weighting, IPW, Cox model, non-proportional, Kaplan-Meier, generalized gamma AFT, pseudo observations, RMST
References
Andersen, P. K., Hansen, M. G., & Klein, J. P. (2004). Regression analysis of restricted mean survival time based on pseudo-observations. Lifetime Data Analysis, 10(4), 335– 350.
Handorf EA, Smaldone MC, Movva S, and Mitra N. (2023). “Analysis of survival data with nonproportional hazards: A comparison of propensity-score-weighted methods”. Biometrical Journal. First published: 21 December 2022. https://doi.org/10.1002/bimj.202200099
Rosenbaum, P. R., & Rubin, D. B. (1983). The central role of the propensity score in observational studies for causal effects. Biometrika, 70, 412– 8.
https://onlinelibrary.wiley.com/cms/asset/a27dc627-8631-49b3-af4e-c258b1b94002/bimj2418-fig-0001-m.jpg