October 13, 2022
A recent article in JAMA, “Association of Primary and Booster Vaccination and Prior Infection With SARS-CoV-2 Infection and Severe COVID-19 Outcomes” focuses on looking at the association of COVID-19 vaccination and boosters or prior infection with subsequent infection and severe COVID-19 outcomes. A cohort study of 10.6 million North Carolina residents from March 2020 to June 2022 was conducted to study this association. The exposure variables included the BNT162b2, mRNA-1273, and Ad26.COV2.S vaccines (Pfizer, Moderna, and Johnson-Johnson in that order), as well as SARS-CoV-2 infection during periods of pre-Delta, Delta, or Omicron variant predominance.
The statistical analysis section for this paper is fairly detailed. They treated SARS-CoV-2 infections as recurrent events and then formulated the association of vaccination and prior infection with the rate of infection through a multiplicative intensity model, which per their reference is the Anderson and Gill counting process version of the Cox proportional hazards regression model. They also used the Cox model to associate the vaccination and prior infection with the hazard of hospitalization or death.
In the first set of analyses, the association parameters for 1-dose BNT162b2, 2-dose BNT162b2, 1-dose mRNA-1273, 2-dose mRNA-1273, and 1-dose Ad26.COV2.S, as well as for prior infection, were then estimated simultaneously under a single model, which they don’t say is the Anderson-Gill model or regular Cox model, such that the association of one exposure (vaccination or prior infection) with each outcome was estimated while adjusting for the other exposure and assuming no interaction. They censored participants at the time of receipt of booster. The time-varying association of vaccination with each outcome was characterized by their use of a continuous piecewise linear function of time elapsed since the first dose for the log rate ratio (RR) or hazard ratio (HR), with change points placed at approximately every month. The time-varying association of prior infection with each outcome was modeled in a similar manner, with positive results within 2 weeks of the initial diagnosis being treated as the same infection. They handled additional analyses were performed by allowing the associations of vaccination and prior infection with outcomes to depend on the time periods of vaccination and prior infection, respectively.
Their second set of analyses was concerned with estimating the effectiveness of the booster among participants who had completed a primary vaccine series. The time-varying association of booster with each outcome was again characterized by a continuous piecewise linear function of time elapsed since boosting for the log RR or HR between booster and primary vaccination, with change points placed at approximately every month. The analyses on the outcome of infection were performed separately for 6 common combinations of primary and booster vaccines, whereas the analyses on the outcomes of hospitalization and death were performed for all combinations together because of small numbers of events.
Their third set of analyses was designed to assess the interaction between booster vaccination and prior infection (i.e, how the estimated effectiveness of the booster by itself depends on the prior infection status), amongst participants who had completed a primary vaccine series. The association parameters for prior infection among participants with primary vaccination and for booster among previously infected vs previously uninfected participants were estimated under a single model, for which they again don’t specify.
In all their analyses, they included demographic variables (age, sex, race and ethnicity, geographic region, county-level vaccination rate) as covariates to adjust for potential confounding by individual characteristics and geographic location. They also included the date of primary series as a covariate when estimating booster parameters. They obtained their coefficients from partial likelihood estimates. The effectiveness of vaccination or prior infection was estimated by 1 minus the estimated rate ratio or HR multiplied by 100%; corresponding 95% CIs were constructed. Nothing is said about how they handled missing data unless you go to the Supplement where they provide a lot of detail about their statistical analyses. Here they say they imputed missing data but never say what assumption they made, be it missing at random or not missing at random for the outcomes they imputed for hospitalization and death. They called it a sensitivity analyses but it was not clear if they were exploring the nature of the missinginess. Finally, they do admit they had a large number of analyses but then end up calling all of it exploratory analyses. This was rather disturbing to read since they were running so many models and doing so much hypothesis testing and then to call it all exploratory with no adjustment for multiple testing did not seem to upload to good statistical rigor.
The median age among the 10.6 million participants was 39 years which appeared a bit on the younger side. Their demographics were: 51.3% were female, 71.5% were White, and 9.9% were Hispanic and very surprising that they had no African Americans in their dataset?
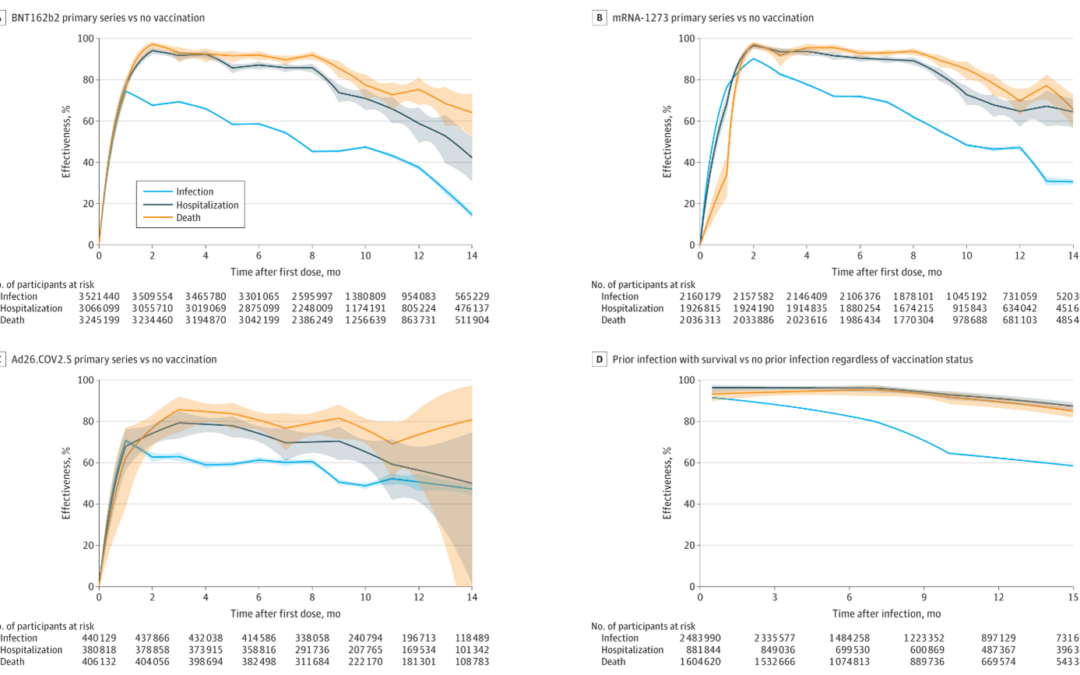
Their adjusted RR of the primary vaccine series compared with being unvaccinated against infection was 0.53 (95% CI, 0.52-0.53) for BNT162b2, 0.52 (95% CI, 0.51-0.53) for mRNA-1273, and 0.51 (95% CI, 0.50-0.53) for Ad26.COV2.S 10 months after the first dose. Their adjusted HR for hospitalization remained at 0.29 (95% CI, 0.24-0.35) for BNT162b2, 0.27 (95% CI, 0.23-0.32) for mRNA-1273, and 0.35 (95% CI, 0.29-0.42) for Ad26.COV2.S and their adjusted HR of death remained at 0.23 (95% CI, 0.17-0.29) for BNT162b2, 0.15 (95% CI, 0.11-0.20) for mRNA-1273, and 0.24 (95% CI, 0.19-0.31) for Ad26.COV2.S.
In terms of boosting, for the BNT162b2 primary series, boosting in December 2021 with BNT162b2 showed an adjusted RR relative to primary series of 0.39 (95% CI, 0.38-0.40) and boosting with mRNA-1273 had an adjusted RR of 0.32 (95% CI, 0.30-0.34) against infection after 1 month and boosting with BNT162b2 had the adjusted RR of 0.84 (95% CI, 0.82-0.86) and boosting with mRNA-1273 had the adjusted RR of 0.60 (95% CI, 0.57-0.62) after 3 months. Among all participants, the adjusted RR of Omicron infection compared with no prior infection was estimated at 0.23 (95% CI, 0.22-0.24) against infection, and the adjusted HRs were 0.10 (95% CI, 0.07-0.14) against hospitalization and 0.11 (95% CI, 0.08-0.15) against death after 4 months. What was confusing about their results besides lots of information to present is that they mix presenting RRs and HRs. In summary, they state that they found that the receipt of primary COVID-19 vaccine series compared with being unvaccinated, receipt of boosters compared with primary vaccination, and prior infection compared with no prior infection were all significantly associated with lower risk of SARS-CoV-2 infection (including Omicron) and resulting hospitalization and death. However, they found that the associated protection waned over time, especially against infection.
Written by,
Usha Govindarajulu
Keywords: COVID-19, long COVID, Sars-CoV-2, vaccination, boosters, prior infection, unvaccinated
References
Lin D, Gu Y, Xu Y, et al. Association of Primary and Booster Vaccination and Prior Infection With SARS-CoV-2 Infection and Severe COVID-19 Outcomes. JAMA. 2022;328(14):1415–1426. doi:10.1001/jama.2022.17876
https://cdn.jamanetwork.com/ama/content_public/journal/jama/939011/joi220106f1_1664819892.81146.png?Expires=1668786095&Signature=npDCkrjdBtKNR0L6EiXPPaudyv-4XOUZo1-wmqIb34XrstbRjqC3OUABi6mYukvgeCXRwW5KCJOE9XNE-z1lpI6PwXkOwgaVEOEW412FtJPi7BgNzwOfI5834G-qAMg7w8tYktGkpga2WQdnvDt9iZebGt5A~zeUAsFr-v90-3nox~jMAAPqmTomhAHcAhUyWECPmp1RckCv~e8QwghMOypBs3yhQVgKrNSbrdSjidc5KIE7G1P1pKerYRAYuzHpQadw8ylSdI~zQQkzp8-5Sqm8NOLlKkN-ZxlLE1E9Z92fopSqdRKI9sujopvh5G2X43pMVJTZ1ZfrxEw7RIY6vg__&Key-Pair-Id=APKAIE5G5CRDK6RD3PGA