April 26, 2023
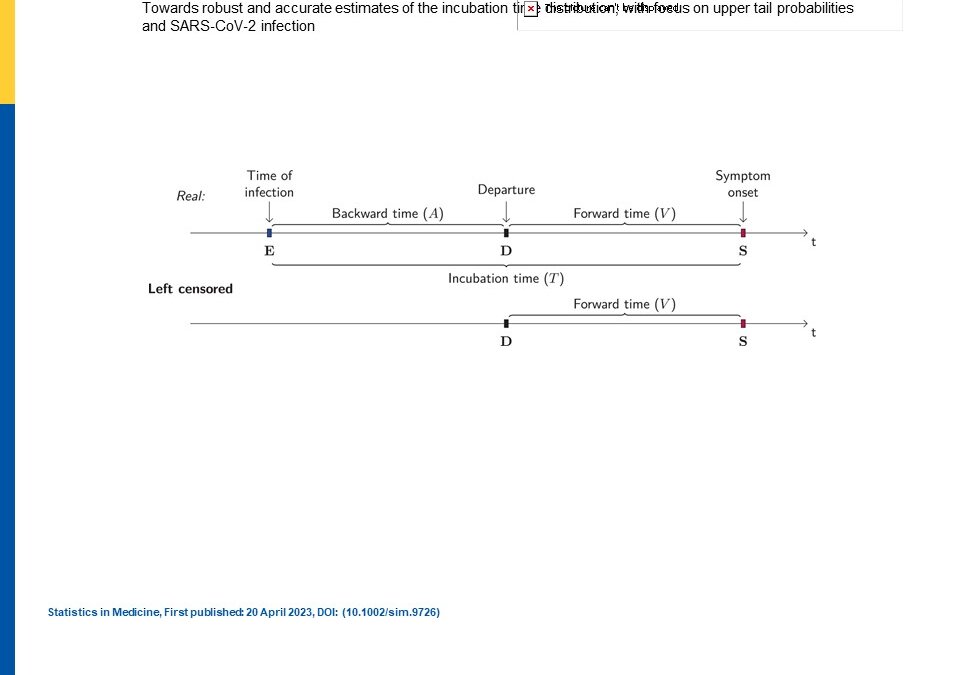
In a recent article that appeared in Statistics in Medicine, Arntzen et al discussed that quarantine time length for persons infected with SARS-CoV-2 was based on incubation time distribution estimates. However, given the unknowns about time to infection and estimating the distribution, the authors came up with a semiparametric method to avoid the usual parametric distribution choice. Previously a 14 day quarantine period was given by the WHO recommendation. In making these estimations, knowing the time origin is challenging and usually one only knows the end so that makes it censored or left censored. Most studies have assumed a uniform distribution. Of course the largest problem has been estimating the time exposure window since contact tracing and recall bias of these information during the pandemic have been poor.
Usually a parametric distribution has been applied to the data like lognormal, gamma, and Weibull but this has not been based on biological evidence. Originally, data was also based on Wuhan data, which had more availability about contact tracing, yet still assumptions had to be made about time of infection based on symptom onset data. They showed their setup for the log-likelihood of time to infection and several iterations of it until their final derivation in Equation 6. They then used simulations to test their assumptions and employed varying distributions of risk time with three types: constant, exponential with 5 day doubling rate, and declining risk of transmission. They also tried different distributions with lognormal, Weibull, and a Burr distribution. In R software, they used the following packages: flexsurv (parametric), survival (NPMLE), and smoothSurv (semi-parametric using penalized Gaussian mixture (PGM), of which no detail is given regarding the mixture distributions). They found the PGM performed the best in the simulations while the parametric distributional assumptions tended to have problems in bias and coverage. The PGM also generally outperformed the NPMLE.
They then discussed another simulation where they studied the renewal process, where they assume travel from say Wuhan, China, was independent of infection and symptom onset and occurred randomly after infection. Travel times were based on a uniform distribution and incubation times were drawn from a lognormal and Weibull distributions and a more heavy tailed Burr distribution. They also tried to mimic the Wuhan scenario. They found bias occurred when the wrong parametric distribution was selected.
They also chose a real data example of six publicly available datasets, 5 from China and 1 from Singapore. They also used similar models as had run in the simulations. These real dataset results overall matched with the results of the simulations and showed the PGM model again best fitting. In summary, mostly an incorrect parametric assumption was a problem but also assuming constant risk could be a problem as well. For these reasons, the PGM worked well, however, the method also required lambda to be chosen for the smoothing and the default setting was not satisfactory so a manual setting for the smoothing parameter would have to be employed.
Written by,
Usha Govindarajulu
Keywords: COVID-19, survival analysis, SARS-CoV-2, contact tracing, infection, incubation, parametric, semi-parametric
References
Arntzen VH, Ficcco M, Leitzinger N, and Geskus RB. (2023). “Towards robust and accurate estimaes of the incubation time distribution, with focus on upper tail probabilities and SARS-CoV-2 infection” Statistics in Medicine (open access).
https://doi.org/10.1002/sim.9726
https://onlinelibrary.wiley.com/cms/asset/8762cc09-2eaf-430c-b4ea-ff1b9c81f758/sim9726-fig-0002-m.jpg