May 7, 2025
The authors have presented a tutorial on joint latent class models (JLCMs), which are a statistical approach to allowing to simultaneously account for two outcomes related to disease progression, a longitudinal measure and a time-to-event measure. A linear mixed effect model is then connected to a survival model via a model for latent classes, describing the unobserved population heterogeneity. These models can be useful in studies of an association between a biomarker and an event of interest, studies of associations between predefined variables and change over time in the biomarker or event of interest, and prediction of event occurrence in a population with heterogeneous disease progression.
The JLCM is based on a mixture model which is an extension of a mixed latent class model. It is a combination of a linear mixed model and a survival model. A discrete random variable defines latent groups or classes. The membership is taken into account by using a multinomial logistic sub-model that describes change over time in the marker in each latent class, a linear mixed sub-model which describes the change over time in the marker in each latent class and then a survival sub-model which describes the risk of an event in each class. The linear mixed sub-model is then specific to each latent class, g. There are separate vectors of variables, one for those common to all latent classes and then the other for fixed effects specific to latent classes. This becomes a random slope and intercept model. The survival model was specified as a Cox model.
The JLCMs are estimated via maximum likelihood for a predefined number of classes or other estimation methods like even a Bayesian approach. In the log-likelihood, the hazard function of the survival model is multiplied onto the survival function and also multiplied onto the density of the multivariate normal distribution of the longitudinal measurements for the ith individual. Due to the definition of the joint model it implied conditional independence between longitudinal observations in the outcome and the censored time-to-event data. The survival sub-model additionally includes the random effects shared with the mixed linear sub-model. Finally, the likelihood of the model is defined in terms of the given number of latent classes. The optimal number of latent classes can be found by finding a compromise between the Bayesian information criterion, number of individuals per class, clinical considerations, the individuals’ classification, and the results of the conditional independence hypothesis test for the two outcomes of interest. Also a score test had been developed for this comparison amongst classes to help decide on the best choice.
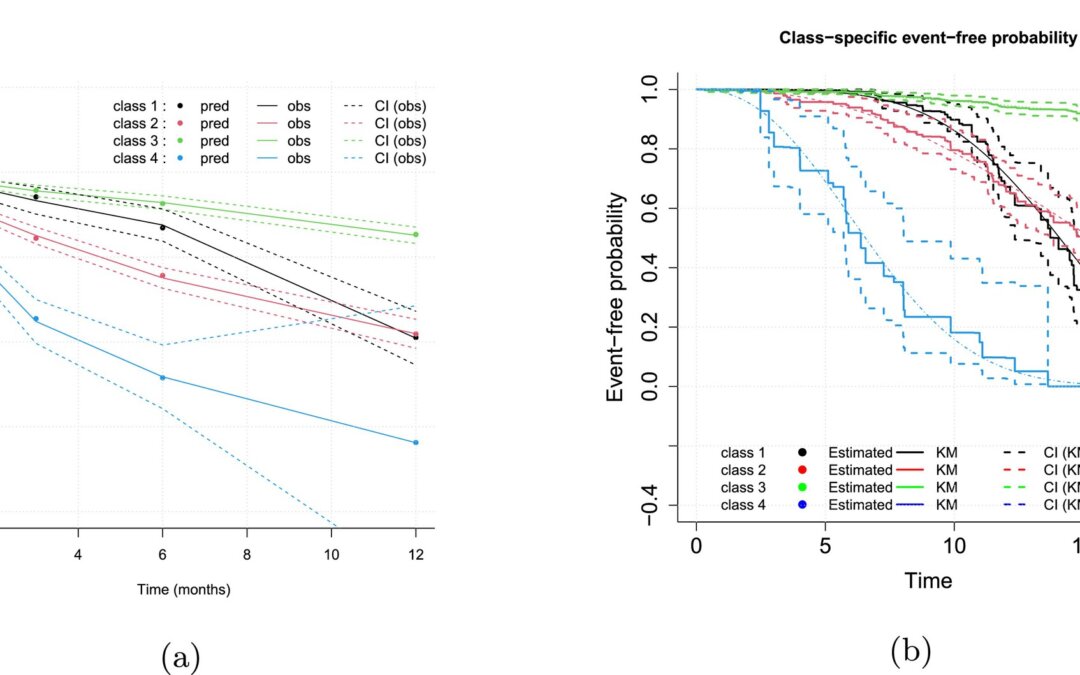
For goodness-of-fit, its suitability is assessed by 1)analyzing the model’s discriminant power (via an a posteriori classification), 2)analyzing the model’s predictive power (via graphs of predictions vs observations), and 3)studying the residuals of the mixed linear sub-model. For 1), each individual is assigned to a class with the highest probability a posteriori. For 2), predictions can be calculated from the mixed sub-model conditional on the random effects. For 3), the normality of the residuals can be checking by graphing the conditional residuals vs conditional predictions. One other caveat is that one can compare observed and model-estimated survival curves.
They showed several real data examples. From both one can obtain separate estimates of the survival model, in this case, Weibull model, and of the longitudinal model. Everything discussed above could be calculated for these datasets. Another item that joint latent class models can do is to predict the occurrence of an event from the change over time in a biomarker. Everything was demonstrated with their R package, lccm.
Written by,
Usha Govindarajulu
Keywords: joint latent class model, survival, longitudinal, linear mixed effects
References:
Kyheng M and Babykina G (2025) “Joint Latent Class Models: A Tutorial on Practical Applications in Clinical Research” Tutorial in Biostatistics, Statistics in Medicine.
https://doi.org/10.1002/sim.70047
https://onlinelibrary.wiley.com/cms/asset/cfe354f5-13e4-4571-8fc2-052aa44512e7/sim70047-fig-0002-m.jpg