June 21, 2023
Quantile regression has been around for awhile but has not been used so extensivly in survival analysis, namely for comparisons at the population level. The authors, Williamson et al, proposed analyzing relative survival data using quantile regression (Kroenker & Bassett, 1978; Kroenker & Geiling, 2001), which as they have said, allows one to model the quantiles of a response variable as a function of covariates with adjustment for potential confounders.
What makes this different is that the relative survival (excess mortality) is expressed not in terms of relative hazards or survival rates but rather it is expressed as the difference in failure times between the study cohort and the population that has similar demographics which would then be evaluated at a quantile of interest, for example the median. The quantile regression ends up modeling the relationship between the covariates in the model and the conditional quantiles of the response Y given X = x. It also is advantageous over regular regression as it can incorporate data with heterogeneous conditional distributions (Chen, 2005).
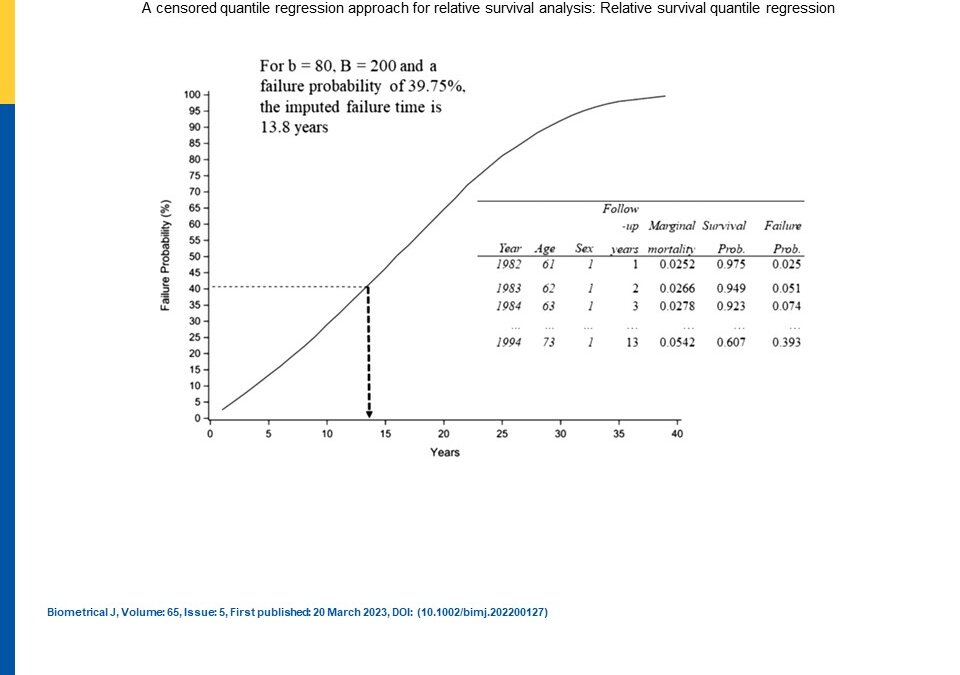
The authors also used what they called “pseudo” population observations that they said were “imputed” into a censored quantile regression model to control for expected mortality ,which is not the same as pseudo-observations known from jackknife methodology (e.g., Andersen et al., 2003; Miller, 1974). Their population pseudo-observations came from the population life tables of individuals with similar demographics. They calculated parameter estimates and their standard errors with the bootstrap approach. The beta coefficients from the quantile regression represented relative survival of the members of the study population in relation to population counterparts. They had also used a Blom-like positioning method to place B points equally spaced along range of failure probabilities and then randomly chose from these points to impute the corresponding failure time based on the survival curve.
The authors conducted a simulation study. It is not clear why they selected log-logistic survival times other than since it does not have to meet proportional hazards. They found little bias in the relative survival parameter estimation and also the coverage probabilities were above 95% for all simulation scenarios. Thery also evaluated their method in a real dataset application but did not really discuss the performance of their method in terms of metrics like bias and coverage probabilities. They overall suggested that this method is useful as a flexible alternative to dealing with comparing a study cohort and a population of interest. They admitted that it doesn’t always converge when survival times are large but no other discernable weaknesses were pointed out by them.
Written by,
Usha Govindarajulu
Keywords: survival, quantile regression, censoring, hazards
References
Andersen, P. K, Klein, J. P., & Rosthoj, S. (2003). Generalised linear models for correlated pseudo-observations, with applications to multi-state models. Biometrika, 90(1), 15– 27.
Chen, C. L. (2005). An introduction to quantile regression and the QUANTREG procedure. SAS Global Forum. SAS Institute, Inc., Paper 213-30.
Koenker, R., & Bassett, G. W. (1978). Regression quantiles. Econometrica, 46, 33– 50.
Koenker, R., & Geling, O. (2001). Reappraising medfly longevity: A quantile regression survival analysis. Journal of the American Statistical Association, 96, 458– 468.
Miller, R. G. (1974). The jackknife – A review. Biometrika, 61, 1– 15.
Williamson, JM, Lin H-M, and Lyles RH. (2023). “A censored quantile regression approach for relative survival analysis: Relative survival quantile regression” Biometrical Journal.
https://onlinelibrary.wiley.com/doi/full/10.1002/bimj.202200127?campaign=woletoc
https://onlinelibrary.wiley.com/cms/asset/573df40e-2924-4fb3-b4ad-2aacdcf6cd4d/bimj2452-fig-0001-m.jpg
