March 12, 2025
The authors used a novel method based on wavelet filtering and landmarking to obtain the prognostic role of a biomarker in patient death. Wavelet filters have been common in time series data to extract features and reduce noise. They also utilized landmark last observation carried forward model (LOCF) and the landmark mixed survival model along with the novel landmark wavelet model.
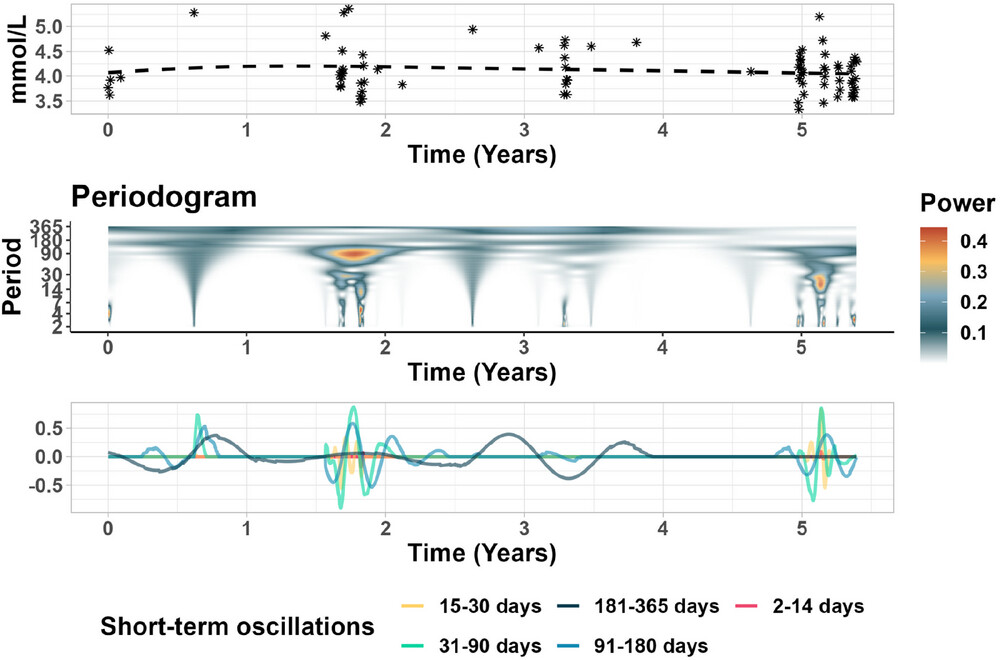
In their methods they described different landmark methods to consider for obtaining dynamic predictions of survival. Their landmark LOCF used a grid of time points, called landmarks, in which information on their main predictor, potassium, can be updated. At each landmark point, they studied the association between potassium and time of death by estimating a Cox proportional hazard model using as a covariate the last potassium measurement collected before the landmark point. They also delineated a mixed landmark model where they modeled individual potassium trajectories using a linear mixed effect model. For both methods they were able to derive dynamic predictions. Finally, they described their mixed-wavelet landmark models, which used linear mixed effect models along with wavelets. They focused on the wavelet Morlet (WM) filter, which are continuous, complex valued functions used to smooth nonstationary time-series data and can distinguish frequencies at which oscillations occur. This transform is characterized by a mother wavelet. They used it to extract from the repeated measures data by applying it to the residuals of the linear mixed effect model. In incorporating the wavelet filter into their model, they defined a landmark wavelet Cox model which has covariates terms with one being a vector of predicted slope at each landmark time from the linear mixed effect model and now the second being a vector of local changes in the biomarker at different duration intervals of interest for the ith subject, each with a non-linear transform like a spline basis.
They then ran simulations in two parts, their longitudinal potassium trajectories, and their survival process. They first generated the trajectories by using linear mixed effect models and in the second part, sampled times with replacement from a Weibull distribution with set scale and shape parameters. For performance measure they used a mean squared error. In the first part of the simulation, their new model performed well. In the second part, they aimed to assess the performance of different landmark survival models where they varied the duration of intervals in terms of dynamic predictive accuracy. They found that in all the scenarios that the LOCF performed the worst. The mixed landmark model and their mixed wavelet landmark model performed well in a number of scenarios but if the mixed model is mis-specified than that affected performance. They also applied their method to a real dataset analysis. They compared different landmark survival models by AIC, BIC, and concordance index. Their model showed the best goodness-of-fit via all these criteria. They also validated by discrimination measures like AUC and Brier. Their new method showed the highest discrimination.
Overall, they found their new method of landmark mixed wavelet modeling worked well in both simulations and real data analysis. Their use of mixed landmarks model for dynamic biomarker surveillance worked well and their coupling wavelet filters with linear mixed effect models was an added benefit. This method allowed them to show short-term changes in the prognostic biomarker. The authors did not discuss that they relied on Cox model analysis and how this affected their modeling with its assumptions.
Written by,
Usha Govindarajulu
Keywords: survival analysis, wavelet-mixed landmark survival models, Cox model
References:
Gregorio C, Barbati G, Scagnetto A, di Lendarda A, and Ieva F (2025) “Wavelet-Mixed Landmark Survival Models for the Effect of Short-Term Changes of Potassium in Heart Failure Patients” Biometrical Journal, https://doi.org/10.1002/bimj.70043
https://onlinelibrary.wiley.com/cms/asset/cd311a26-7f87-4541-aa81-7de3524b2e44/bimj70043-fig-0005-m.jpg