
November 4, 2026
Cox regression (Cox, 1972) is most widely used for developing prognostic models in medical time-to-event data (Collins et al, 2014, 2011; Goldstein et al 2017; Hueting et al. 2022; Mahar et al 2017; Mallett et al 2010; Phung et al. 2019; Steyerberg et al. 2013; Wynants et al. 2019). It provides estimates of the hazard ratios for each explanatory variable. The random survival forest (Ishwaran et al, 2008) is a machine learning approach which doesn’t have the same constraints as proportional hazards assumption like the Cox model does. For this reason, the authors aims to explore the potential application of the RSF to data from randomized controlled trials (RCTs) by comparing its predictive performance to the Cox proportional hazards (Cox-PH) model.
They tested the comparisons between methods on real and simulated datasets. They also used the nonparametric bootstrap approach for point estimates by Wahl et al (2016) which is also based on the 0.632 + bootstrap method (Efron and Tibshirani, 1997). Their 0.632 + bootstrap estimate is computed as a weighted average of the performance (training and test data) and the average “out-of-bag” (OOB) performance computed from B bootstrap datasets.
They computed various performance metrics for both methods. They computed Harrell’s c-statistic in the context of survival data. For the RSF method, the 𝐶 index is computed based on the patient-specific predictions of the ensemble mortality in the terminal nodes of each tree. For this, the OOB ensemble estimator of the cumulative hazard function (CHF) at time 𝑡 for patient 𝑗, 𝐻oobj(𝑡), is considered. It is given by the average prediction of the 𝑛tree𝑗 trees for which the sample was not part of the bootstrap sample for building the tree (Ishwaran et al, 2021).
A calibration plot of observed versus predicted probabilities of mortality indicates deviation from perfect prediction, the more the slope deviates from the ideal line with slope 1 (Van Calster et al., 2019). It quantifies the agreement between the actual and predicted outcome within a specified duration of time. The IBS (Graf et al, 1999) summarizes the Brier scores over time; so it is a time-range performance measure. The Brier score essentially calculates the difference between predicted and actual survival at a given time point, and values that are closer to zero indicate better overall performance.
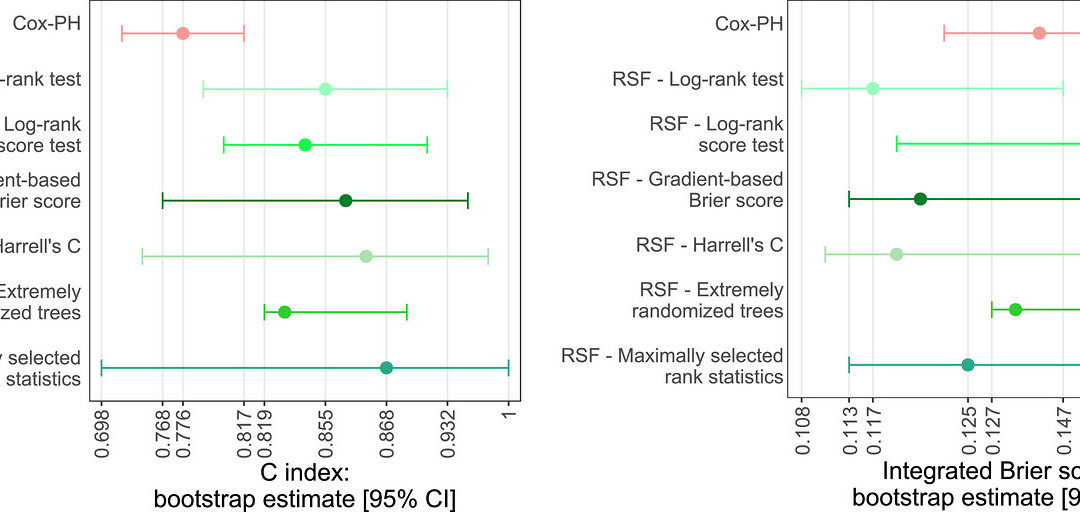
In their discussion, the authors reported that similar to the findings of previous studies, in their simulation study, the RSF predictions were usually more accurate with respect to the 𝐶 index, with some exceptions for the data with higher (60%) censoring. In the case of these higher censoring rates, the Cox model performed better in the nonproportional hazards setting in the absence of treatment–covariate interactions, and in the case of multiple treatment–covariate interactions for constant and decreasing hazards with larger sample sizes (𝑁 =200,𝑁 =400). In terms of overall performance measured by the IBS, the Cox model performs considerably better in the nonproportional hazards setting for both censoring rates (30%, 60%) in the data without treatment–covariate interactions, but in the presence of treatment–covariate interactions, the RSF performed better for nonproportional hazards. They concluded that the overall performance of the Cox model is only affected by deviations from the proportional hazards assumption in the presence of treatment–covariate interactions and that overall performance of the Cox model improves more visibly with increasing sample size, while RSF results are more stable across different sample sizes, which could be due to its ability for good performance even in high-dimensional settings. In term of calibration, results for the RSF are worse than those for the Cox model in many cases with considerable differences. Also, their findings suggest a poor performance of the Cox model when considering the 𝐶 index, a conclusion that is less obvious or even reversed when considering the IBS.
The authors also mentioned about alternative splitting rules for the RSF besides the originally used log-rank test. They mentioned the C index estimates for extremely randomized trees splitting rule and the gradient-based Brier score splitting rules. Also, some of these splitting rules could be used to change the computational times of RSF splitting rules.
Written by,
Usha Govindarajulu, MS PhD
Keywords: survival analysis, Cox model, RSF, clinical trials, Brier score, c-statistic, calibration, proportional hazards
References:
Cox, D. R. 1972. “Regression Models and Life-Tables.” Journal of the Royal Statistical Society. Series B (Methodological) 34, no. 2: 187–220.
Collins, G., J. De Groot, S. Dutton, et al. 2014. “External Validation of Multivariable Prediction Models: A Systematic Review of Methodological Conduct and Reporting.” BMC Medical Research Methodology 14: 40.
Collins, G., S. Mallett, O. Omar, and L. Yu. 2011. “Developing Risk Prediction Models for Type 2 Diabetes: A Systematic Review of Methodology and Reporting.” BMC Medicine 9, no. 1: 103.
Efron, B., and R. Tibshirani. 1997. “Improvements on Cross-Validation: The 0.632+ Bootstrap Method.” Journal of the American Statistical Association 92: 548–560.
Goldstein, B., A. Navar, M. Pencina, and J. Ioannidis. 2017. “Opportunities and Challenges in Developing Risk Prediction Models with Electronic Health Records Data: A Systematic Review.” Journal of the American Medical Informatics Association 24, no. 1: 198–208.
Graf R, Todd S, and Baksh MF (2026) “Comparison of the Cox Proportional Hazards Model and Random Survival Forest Algorithm for Predicting Patient-Specific Survival Probabilities in Clinical Trial Data” Biometrical Journal https://doi.org/10.1002/bimj.70171
Hueting, T. A., M. C. van Maaren, M. P. Hendriks, H. Koffijberg, and S. Siesling. 2022. “The Majority of 922 Prediction Models Supporting Breast Cancer Decision-Making Are at High Risk of Bias.” Journal of Clinical Epidemiology 152: 238–247.
Ishwaran, H., U. Kogalur, E. Blackstone, and M. Lauer. 2008. “Random Survival Forests.” The Annals of Applied Statistics 2: 841–860.
Mahar, A., C. Compton, S. Halabi, K. Hess, M. Weiser, and P. Groome. 2017. “Personalizing prognosis in colorectal cancer: A systematic review of the quality and nature of clinical prognostic tools for survival outcomes.” Journal of Surgical Oncology 116: 969–982.
Mallett, S., P. Royston, R. Waters, S. Dutton, and D. Altman. 2010. “Reporting performance of prognostic models in cancer: A review.” BMC Medicine 8: 21.
Phung, M. T., S. T. Tin, and J. M. Elwood. 2019. “Prognostic Models for Breast Cancer: A Systematic Review.” BMC Cancer 19: 230.
Steyerberg, E., K. Moons, D. van der Windt, et al. 2013. “Prognosis Research Strategy (PROGRESS) 3: Prognostic Model Research.” PLoS Medicine 10: e1001381.
Van Calster, B., D. McLernon, M. van Smeden, L. Wynants, and E. Steyerberg. 2019. “Calibration: the Achilles Heel of Predictive Analytics.” BMC Medicine 17: 230.
Wahl, S., A.-L. Boulesteix, A. Zierer, B. Thorand, and M. Wiel. 2016. “Assessment of Predictive Performance in Incomplete Data by Combining Internal Validation and Multiple Imputation.” BMC Medical Research Methodology 16: 144.
Wynants, L., D. Kent, D. Timmerman, C. Lundquist, and B. Van Calster. 2019. “Untapped Potential of Multicenter Studies: A Review of Cardiovascular Risk Prediction Models Revealed Inappropriate Analyses and Wide Variation in Reporting.” Diagnostic and Prognostic Research 3: 6.
https://onlinelibrary.wiley.com/cms/asset/91153ab3-e8cf-438b-8210-16cbde5c2b8e/bimj70171-fig-0001-m.jpg